The Data You Already Have
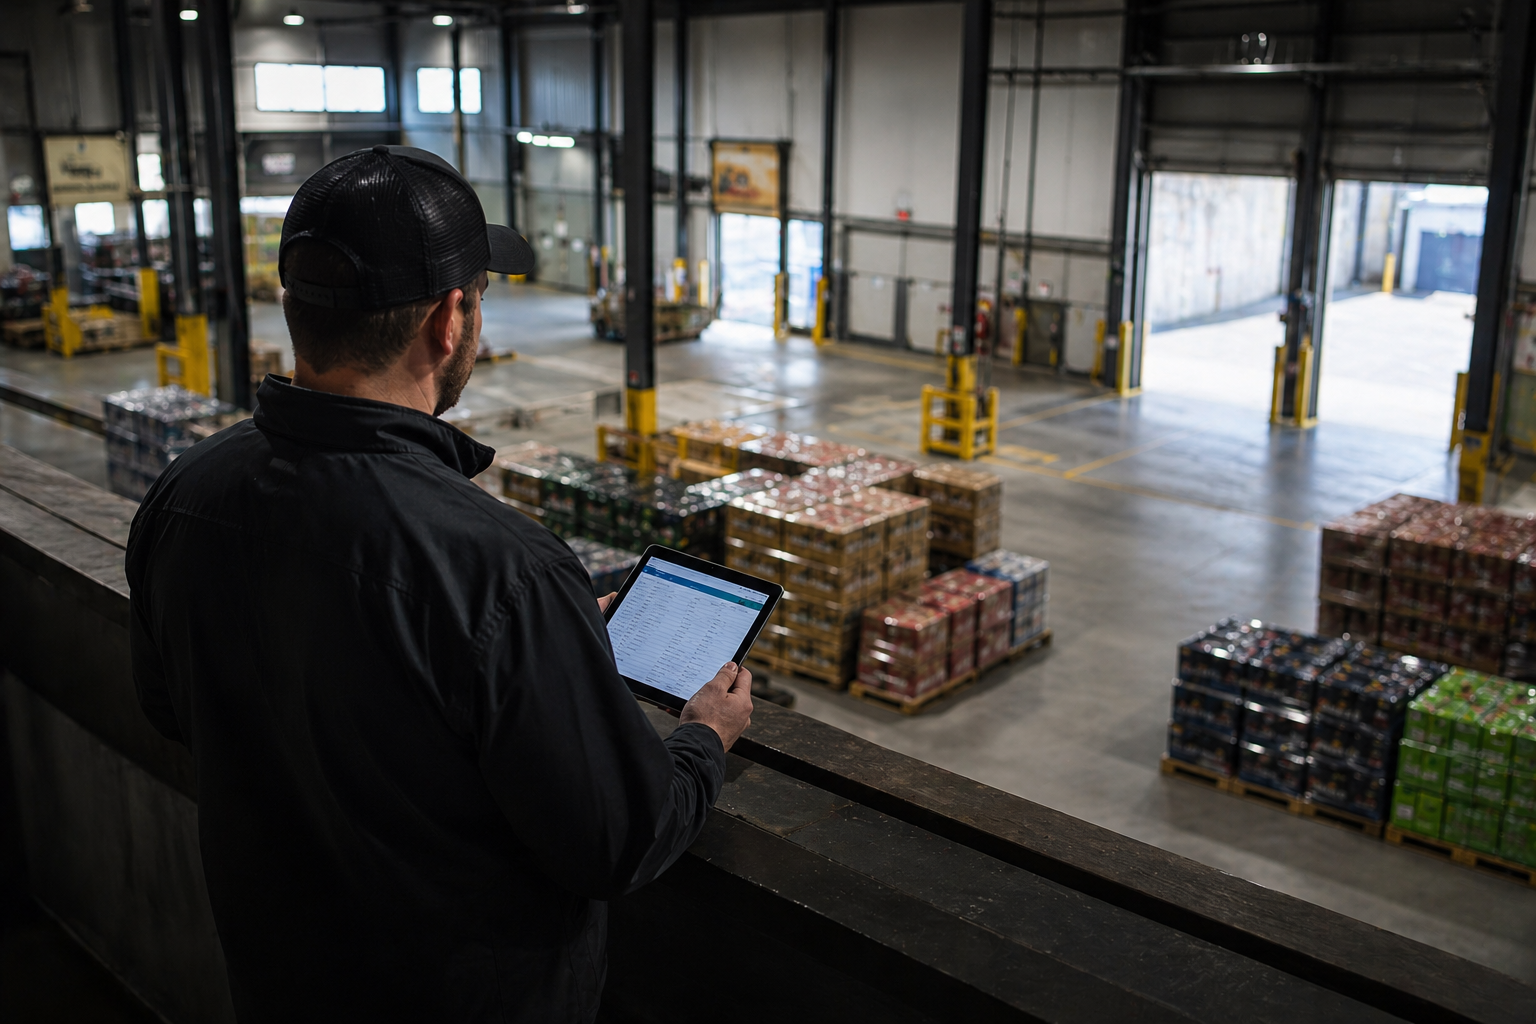
Your 2025 performance is sitting in your operating system. Every invoice, delivery, supplier relationship, and account tells a story. The challenge for many wholesalers is that this data is often fragmented across multiple systems, stuck in spreadsheets, or buried in reports that take days to generate.
The opportunity isn't in having more data; it's having data that's unified and usable for decision-making. Real-time dashboards that compare this year to last year, supplier by supplier, brand by brand, down to individual packaging formats. That's where year-end analysis becomes actionable. You can see exactly which segments grew, which ones bled volume, and where your team actually made money versus where you just moved cases.
Year-over-year comparisons reveal the patterns that quarterly reviews miss. When you can drill from supplier performance down to brand-level trends and then into rep-specific results, you start to see the operational reality behind the top-line numbers. That IPA that seemed hot in Q2 might have stalled by October. That new supplier, which looked promising, might be concentrated in just two accounts.
Turning Retrospective Into Actionable
The challenge isn't generating reports. It's translating those insights into decisions. Analytics capabilities that track 2025 performance can become the foundation for your 2026 strategy when you use them strategically.
Start with inventory turn rates. SKUs that sat longer than industry benchmarks last year represent cash flow opportunities. Your data shows you exactly where you can improve efficiency.
Look at account-level purchasing patterns. Which customers increased their spending? Which ones stayed flat while the market declined? The accounts that grew with you in a down market are your anchors, and they deserve strategic attention.
Route efficiency matters more when margins compress. If last year's delivery data shows certain routes consistently underperforming on case equivalents per stop, that's an opportunity for 2026. The same platform that tracked those routes can optimize them going forward.
What Smart Businesses Do Differently
The businesses that'll win in 2026 aren't waiting for market recovery. They're building operational precision right now. The advantage comes from technology that delivers comprehensive data in a format that actually supports decision-making, not just record-keeping.
When you have a complete view of your operations, you can set account-specific goals backed by actual performance history. You can adjust supplier focus based on what moved and what didn't, backed by data instead of assumptions. You can reallocate route coverage to match where volume actually exists.
Goal-setting this January can be informed by 2025's reality. When you can track goal attainment by account, by rep, by product category in real-time, you know exactly where you stand.
The Ohanafy Advantage
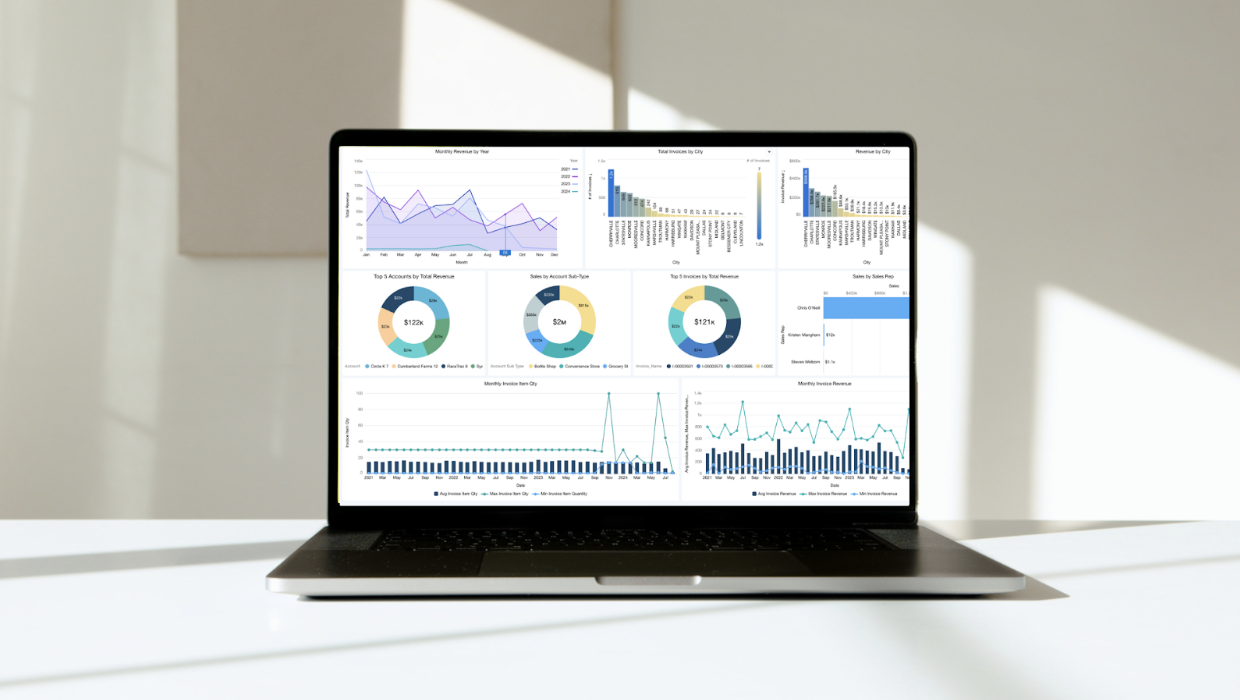
This is where technology makes the difference. Ohanafy creates a single source of truth where warehouse operations, sales performance, and financial results connect seamlessly. When those systems talk to each other, year-end analysis becomes the foundation for operational planning instead of just an accounting exercise.
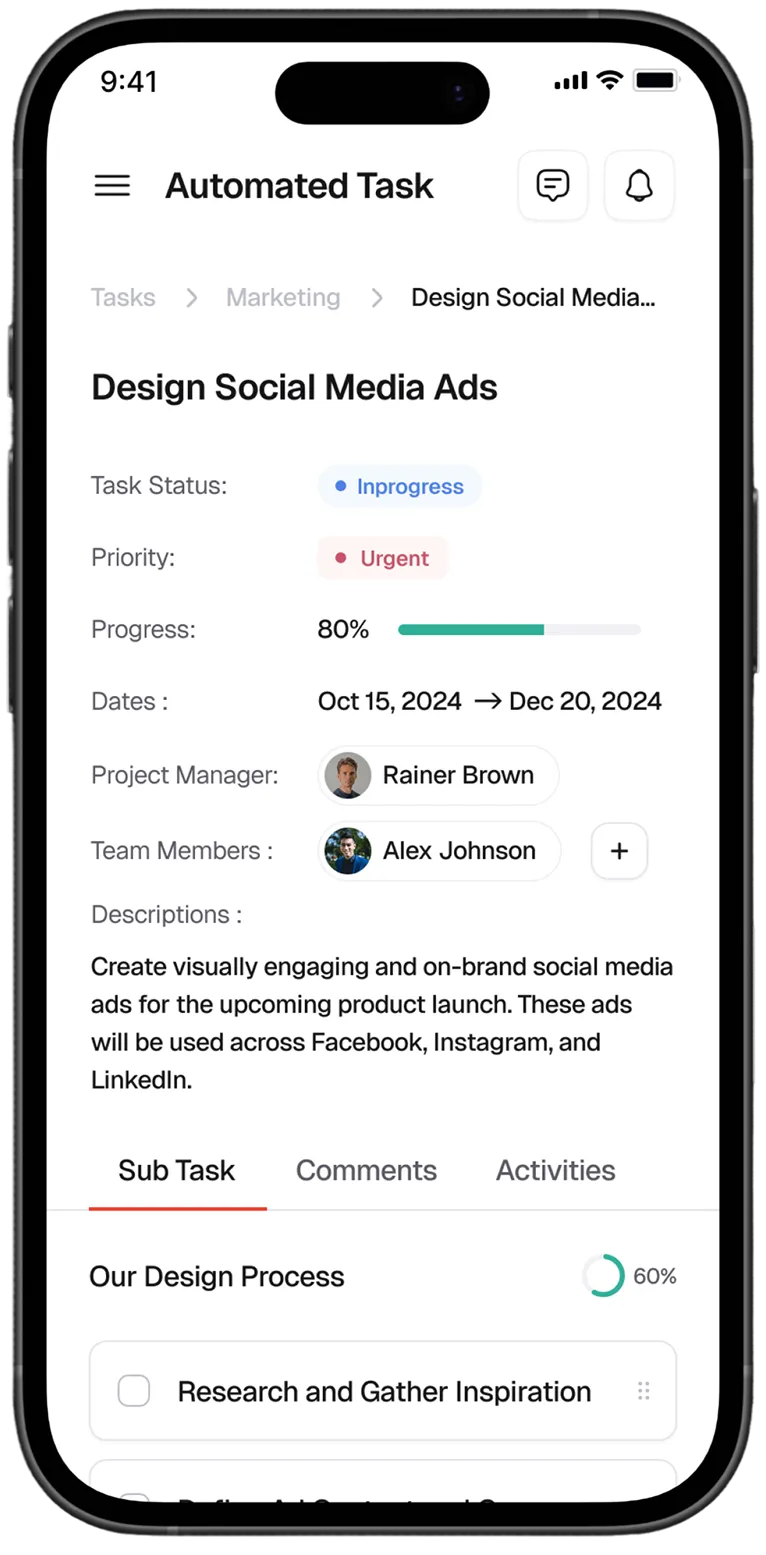
Automated reporting eliminates the lag that used to exist between "what happened" and "what are we doing about it." When your team can pull accurate performance data in minutes instead of days, strategic planning becomes continuous instead of quarterly.
This is the operational advantage that compounds: better data creates better decisions, which creates better performance, which creates better data.
Start Here
Pull your 2025 supplier performance by volume and by margin. You might find suppliers you thought were strong actually underperformed, and suppliers you overlooked that deserve more focus.
Run year-over-year account analysis to identify which customers grew their purchasing despite market headwinds. Those are your 2026 investment priorities.
Compare your inventory turn rates to industry benchmarks. Any product sitting more than 30 days above standard is capital you can redeploy.
Review route-level efficiency metrics. Cases per stop, fuel costs per delivery, and on-time performance are the operational levers you control when you can't control market conditions.
The advantage is having technology that lets you analyze all of this from a single platform. When your warehouse data, sales performance, financial results, and operational metrics live in one system, year-end analysis becomes the strategic planning tool it should be. The beverage businesses that approach 2026 with this kind of operational visibility will move faster, execute cleaner, and protect margins better than those still piecing together spreadsheets.
Turn Your 2025 Data Into a 2026 Game Plan